> ## Documentation Index
> Fetch the complete documentation index at: https://docs.usetuner.ai/llms.txt
> Use this file to discover all available pages before exploring further.
# Best Practices for Agent Monitoring
> Effective monitoring is key to maintaining a high-performing voice agent. This guide provides a set of best practices to help you catch issues early, validate changes with simulation, and establish a data-driven workflow.
## 1. Check the Overview Dashboard Daily
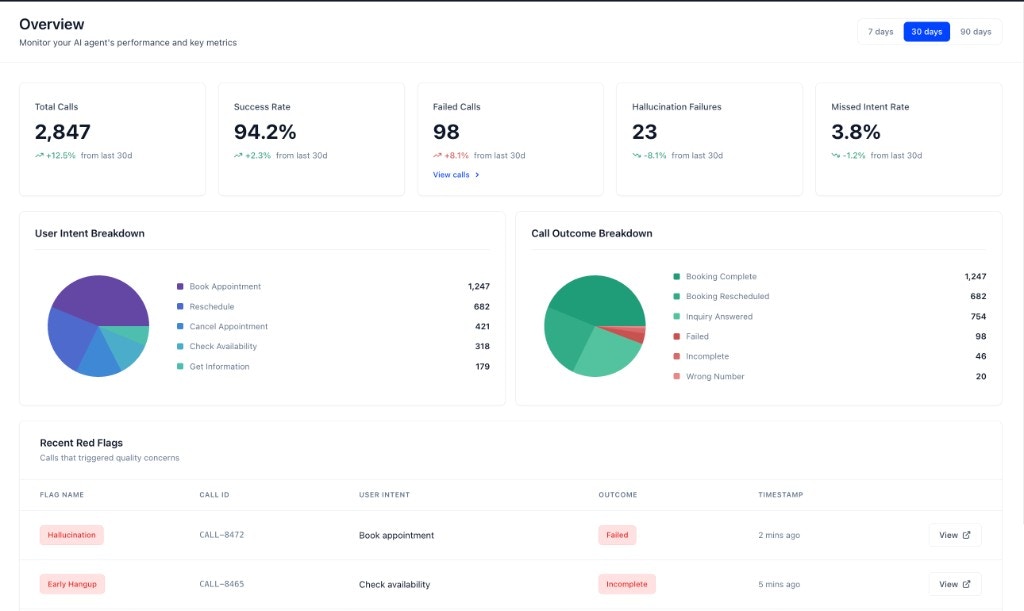
The **Overview** dashboard is your command center. Make it a habit to check it daily to monitor your agent’s health.
 | Metric to Watch | What It Tells You |
| -------------------------- | --------------------------------------------------------------------------------------------------------------------------------------------------------------------------------------- |
| **Success Rate** | A sudden drop is a clear sign that something is wrong. This could be due to a bug, a change in user behavior, or an issue with your agent's logic. |
| **Failed Calls** | Refers to calls with the outcome defined as "Failure" in your Agent Configuration. A high or increasing number indicates systemic issues that need investigation. |
| **Hallucination Failures** | Identifies when your agent is providing incorrect information. This is a critical metric to watch as it can directly impact user trust. |
| **Missed Intent Rate** | Suggests your agent is struggling to understand users. This could be due to a lack of training data, a poorly defined intent, or a change in how users are interacting with your agent. |
| Metric to Watch | What It Tells You |
| -------------------------- | --------------------------------------------------------------------------------------------------------------------------------------------------------------------------------------- |
| **Success Rate** | A sudden drop is a clear sign that something is wrong. This could be due to a bug, a change in user behavior, or an issue with your agent's logic. |
| **Failed Calls** | Refers to calls with the outcome defined as "Failure" in your Agent Configuration. A high or increasing number indicates systemic issues that need investigation. |
| **Hallucination Failures** | Identifies when your agent is providing incorrect information. This is a critical metric to watch as it can directly impact user trust. |
| **Missed Intent Rate** | Suggests your agent is struggling to understand users. This could be due to a lack of training data, a poorly defined intent, or a change in how users are interacting with your agent. |
 ## 2. Configure Meaningful Alerts
Set up Alerts in Agent Settings to be notified of the events that matter most. A well-configured alert can be the difference between catching a problem early and having it affect a large number of users.
Here are some examples of meaningful alerts you can create:
* **Critical Red Flag Spike**: Get an email notification if you get more than 5 `hallucination_detected` red flags in a 1-hour window. This can help you quickly identify if your agent is providing incorrect information.
* **Poor Customer Experience**: Create a "Warning" level alert if the average Politeness / Tone score drops below 3 for more than 10 calls in 15 minutes.
* **Agent Stuck in Loop**: Get a critical alert if a custom `agent_stuck_in_loop` red flag appears more than 3 times in 5 minutes.
## 2. Configure Meaningful Alerts
Set up Alerts in Agent Settings to be notified of the events that matter most. A well-configured alert can be the difference between catching a problem early and having it affect a large number of users.
Here are some examples of meaningful alerts you can create:
* **Critical Red Flag Spike**: Get an email notification if you get more than 5 `hallucination_detected` red flags in a 1-hour window. This can help you quickly identify if your agent is providing incorrect information.
* **Poor Customer Experience**: Create a "Warning" level alert if the average Politeness / Tone score drops below 3 for more than 10 calls in 15 minutes.
* **Agent Stuck in Loop**: Get a critical alert if a custom `agent_stuck_in_loop` red flag appears more than 3 times in 5 minutes.
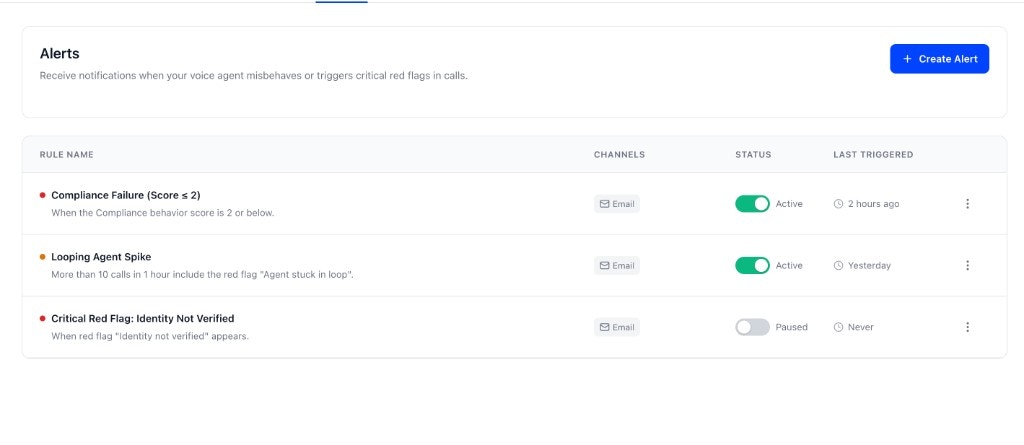 To create an alert, navigate to Agent Settings > Alerts and click Create Alert. From there, you can define the trigger conditions, set the severity, and choose your notification channels.
## 3. Investigate Red Flags Immediately
The **Recent Red Flags** section is your early warning system. You can find it at the bottom of the Overview dashboard. Prioritize and investigate these as soon as they appear.
To create an alert, navigate to Agent Settings > Alerts and click Create Alert. From there, you can define the trigger conditions, set the severity, and choose your notification channels.
## 3. Investigate Red Flags Immediately
The **Recent Red Flags** section is your early warning system. You can find it at the bottom of the Overview dashboard. Prioritize and investigate these as soon as they appear.
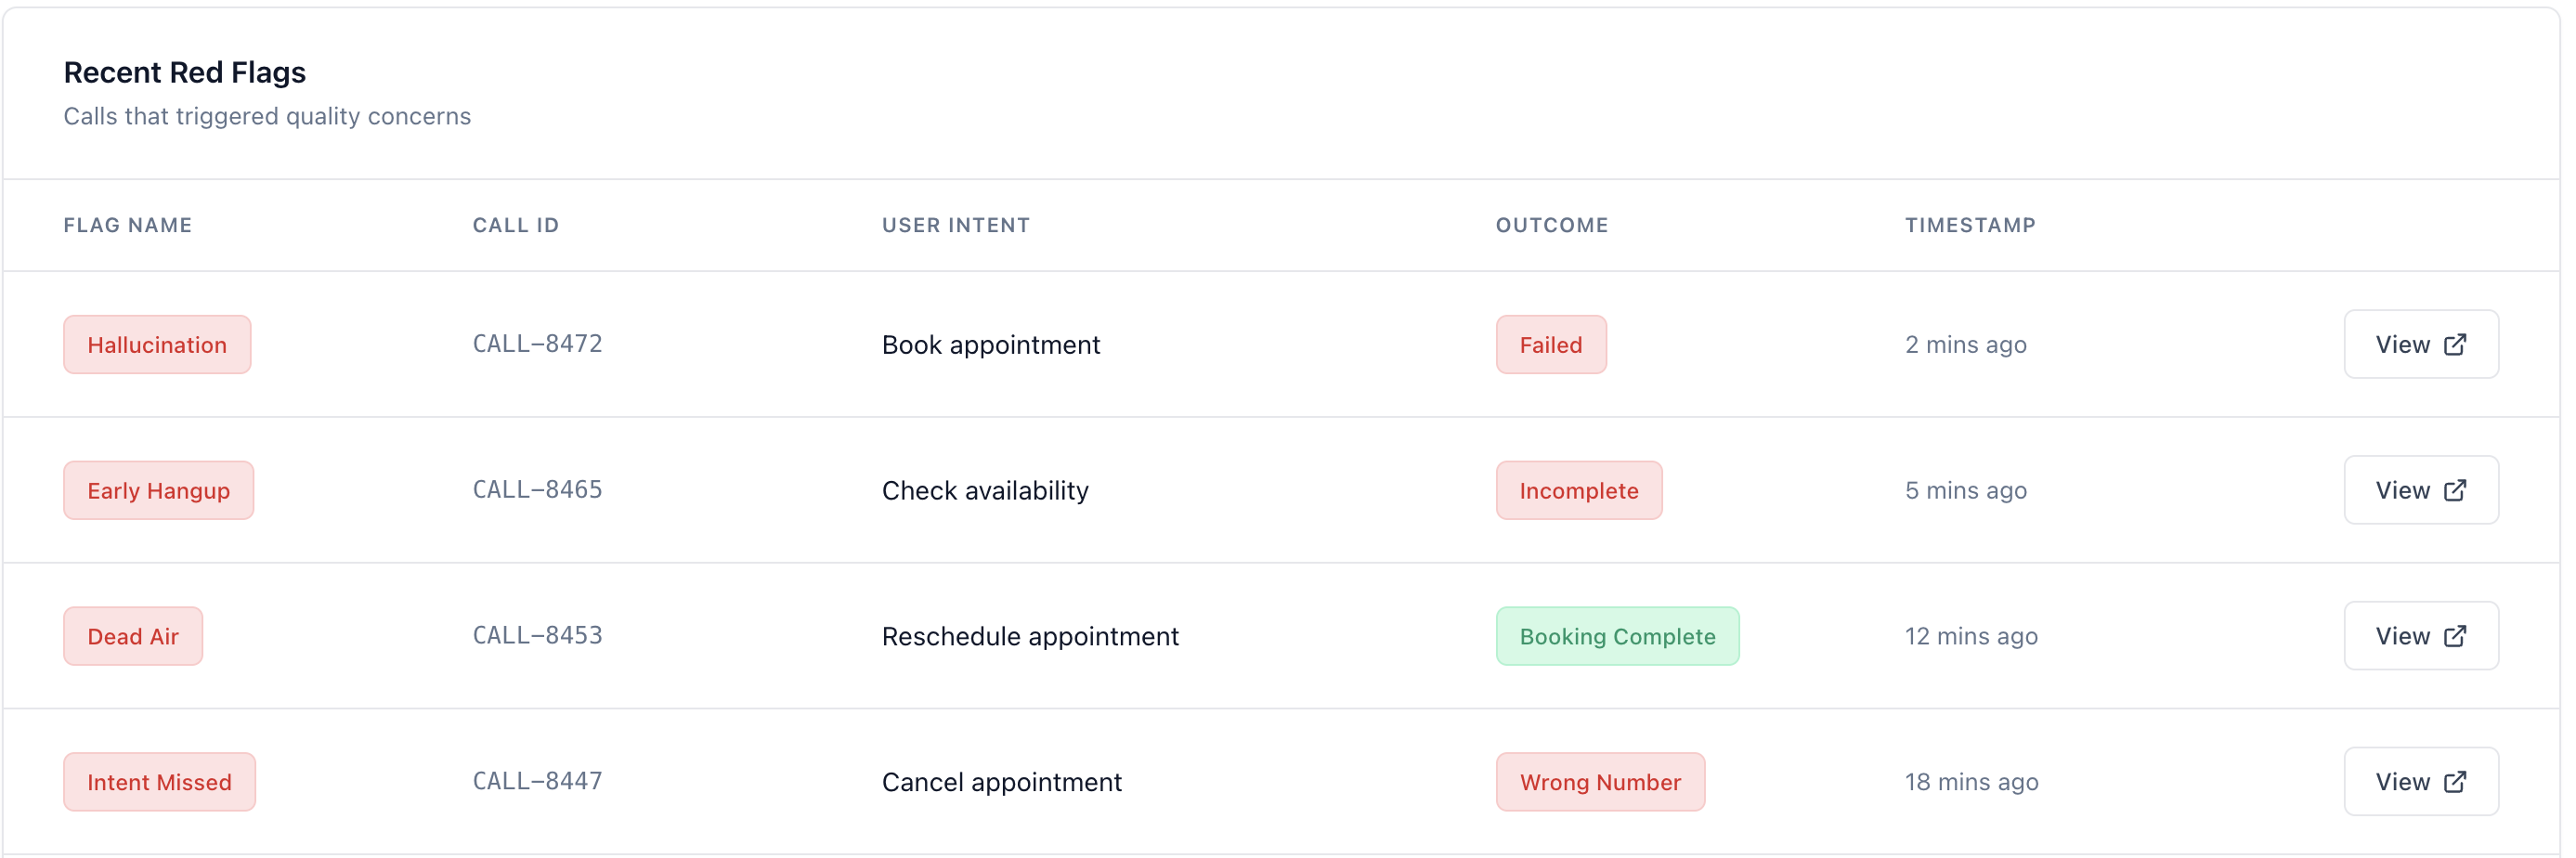 * **Prioritize by Flag Type**: Focus on critical failures like `hallucination_detected` or `compliance_failure`.
* **Drill Down**: Click on a red-flagged call to understand the context of the failure. Tuner provides a detailed explanation of why the red flag was triggered, helping you quickly identify the root cause. For example, if a flag built on the **Tool call missing** eval is raised, Tuner will explain that the agent attempted to use a tool or function that doesn't exist, such as: "The agent tried to call a 'check\_inventory' function that is not defined in the system."
* **Target your next simulation**: When the same red flag keeps appearing, note which eval triggered it. Use that to narrow [**Pressure Tests**](/docs/simulation/overview#the-simulation-mix) in your next simulation run.
## 4. Use Call Logs to Spot Patterns
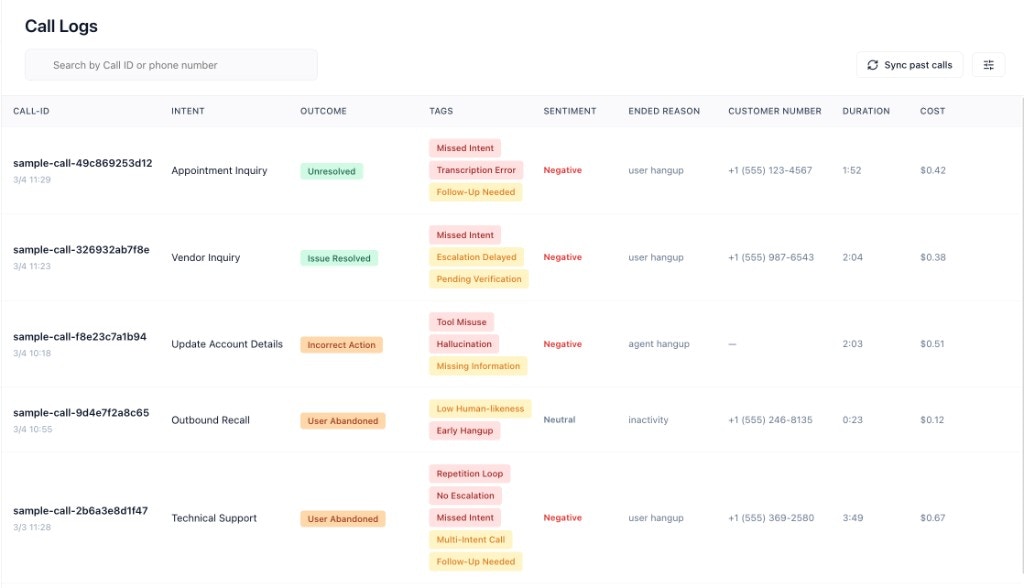
Use the **Call Logs** to uncover deeper patterns. You can access the Call Logs by clicking on Call Logs in the sidebar.
* **Filter by Outcome**: Regularly filter by “Failure” to review recent unsuccessful interactions.
* **Search for Keywords**: Find calls that mention relevant keywords to investigate specific issues.
* **Prioritize by Flag Type**: Focus on critical failures like `hallucination_detected` or `compliance_failure`.
* **Drill Down**: Click on a red-flagged call to understand the context of the failure. Tuner provides a detailed explanation of why the red flag was triggered, helping you quickly identify the root cause. For example, if a flag built on the **Tool call missing** eval is raised, Tuner will explain that the agent attempted to use a tool or function that doesn't exist, such as: "The agent tried to call a 'check\_inventory' function that is not defined in the system."
* **Target your next simulation**: When the same red flag keeps appearing, note which eval triggered it. Use that to narrow [**Pressure Tests**](/docs/simulation/overview#the-simulation-mix) in your next simulation run.
## 4. Use Call Logs to Spot Patterns
Use the **Call Logs** to uncover deeper patterns. You can access the Call Logs by clicking on Call Logs in the sidebar.
* **Filter by Outcome**: Regularly filter by “Failure” to review recent unsuccessful interactions.
* **Search for Keywords**: Find calls that mention relevant keywords to investigate specific issues.
 ## 5. Establish a Weekly Review Cadence
Set aside time each week for a more thorough review.
* **Review Long-Term Trends**: Use the 30-day and 90-day filters to understand performance over time.
* **Analyze User Intent Breakdown**: Look for trends in what users are asking for.
## 6. Diagnose Before You Guess
When you spot a problem in the dashboard — a drop in success rate, a spike in a specific red flag, an intent that keeps failing — the instinct is to start manually reviewing calls one by one. The MCP Diagnose agent does this automatically at scale.
Ask it what's broken and it reads your dashboards, red flags, call logs, and transcripts, finds the pattern, and tells you the root cause and the fix. It also surfaces calls that don't match any of your configured intents, so you can find the gaps you didn't know to look for.
Find what's broken, understand why, and fix it in a single conversation.
## 7. Validate Changes with Data and Simulation
Whenever you make a change to your agent, use Tuner to validate its impact before more live traffic hits the update.
* **Compare Before and After**: Use the date filters on the Overview dashboard to compare production performance before and after a change.
* **Run Call Simulation**: After updating a prompt, workflow, or integration, run a [**Call Simulation**](/docs/simulation/overview) batch to confirm the fix and check for regressions. Simulation uses the same Evals as production and won't affect your live metrics.
* **Look for Unintended Consequences**: A change that improves one metric may negatively impact another. A simulation batch surfaces this faster than waiting for enough production calls to tell the story.
***
### Next Steps
Now that you have a framework for monitoring, dive deeper into the concepts that power Tuner.
An overview of the core concepts that power the Tuner platform.
Run simulation batches to validate changes and catch regressions before they reach customers.
## 5. Establish a Weekly Review Cadence
Set aside time each week for a more thorough review.
* **Review Long-Term Trends**: Use the 30-day and 90-day filters to understand performance over time.
* **Analyze User Intent Breakdown**: Look for trends in what users are asking for.
## 6. Diagnose Before You Guess
When you spot a problem in the dashboard — a drop in success rate, a spike in a specific red flag, an intent that keeps failing — the instinct is to start manually reviewing calls one by one. The MCP Diagnose agent does this automatically at scale.
Ask it what's broken and it reads your dashboards, red flags, call logs, and transcripts, finds the pattern, and tells you the root cause and the fix. It also surfaces calls that don't match any of your configured intents, so you can find the gaps you didn't know to look for.
Find what's broken, understand why, and fix it in a single conversation.
## 7. Validate Changes with Data and Simulation
Whenever you make a change to your agent, use Tuner to validate its impact before more live traffic hits the update.
* **Compare Before and After**: Use the date filters on the Overview dashboard to compare production performance before and after a change.
* **Run Call Simulation**: After updating a prompt, workflow, or integration, run a [**Call Simulation**](/docs/simulation/overview) batch to confirm the fix and check for regressions. Simulation uses the same Evals as production and won't affect your live metrics.
* **Look for Unintended Consequences**: A change that improves one metric may negatively impact another. A simulation batch surfaces this faster than waiting for enough production calls to tell the story.
***
### Next Steps
Now that you have a framework for monitoring, dive deeper into the concepts that power Tuner.
An overview of the core concepts that power the Tuner platform.
Run simulation batches to validate changes and catch regressions before they reach customers.