> ## Documentation Index
> Fetch the complete documentation index at: https://docs.usetuner.ai/llms.txt
> Use this file to discover all available pages before exploring further.
# The Overview Dashboard
> A high-level view of your agent's performance — the five headline metrics, the intent and outcome breakdowns, and the red flag queue.
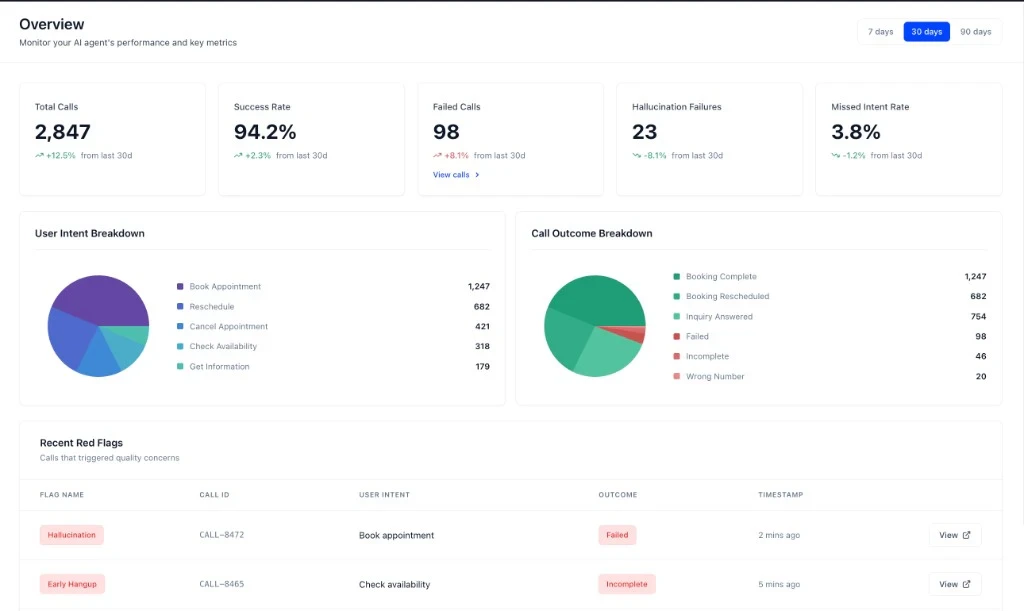
The Overview dashboard is the first place to look when you want a pulse on your agent. It summarizes performance over the selected period, so you can tell whether the agent is broadly healthy with isolated issues, or degraded across the board.
 ## Headline metrics
Five metrics sit at the top, covering the period you select — 7, 30, or 90 days.
| Metric | What it is | What to look for |
| -------------------------- | --------------------------------------------------------- | --------------------------------------------------------------------------------------------------------------- |
| **Total Calls** | Calls your agent handled in the period | Sudden drops can mean an integration broke, not that traffic fell |
| **Success Rate** | Share of calls classified as successful | The clearest single signal that something is wrong. Compare against the previous period, not an absolute target |
| **Failed Calls** | Count of calls classified as failed | A high count alongside a stable success rate means volume grew, not quality dropped |
| **Hallucination Failures** | Failed calls where the agent hallucinated | Any hallucination warrants investigation — this is a trust problem, not a quality gradient |
| **Missed Intent Rate** | Share of calls where the agent didn't understand the user | A rising rate usually means real-world requests have drifted from the intents you defined |
Success Rate, Failed Calls, and Missed Intent Rate all depend on how you've defined [call outcomes and intents](/docs/evaluation/call-classification) — if these numbers look wrong, check those definitions before debugging the agent.
Per-call values like duration and cost aren't headline metrics — they appear on each call in **Call Logs**, and can be used as conditions in [red flag rules](/docs/evaluation/red-flags#available-condition-types).
## Breakdowns
Two charts show how calls distribute across your own labels:
* **User Intent Breakdown** — the mix of reasons people called
* **Call Outcome Breakdown** — the mix of results
These are most useful read together. An intent with high volume and a poor outcome share is where to spend your time first, and it's the same reasoning the [MCP diagnosis](/docs/mcp/diagnose) follows automatically.
## Recent red flags
The bottom section lists calls that tripped one of your rules, with the flag type, call ID, intent, outcome, and timestamp. This is your triage queue — see [Red flags and labels](/docs/evaluation/red-flags#triaging-what-the-flags-surface) for how to work it.
Red flags only appear here if you've defined rules. An empty queue on a busy agent usually means no rules exist yet, not that nothing went wrong.
***
## Next steps
Work through a single problem call end to end.
When the dashboard shows something is wrong, use the MCP to find why across every affected call.
Per-turn timing when the problem is speed rather than behavior.
Define the rules that populate the queue above.
## Headline metrics
Five metrics sit at the top, covering the period you select — 7, 30, or 90 days.
| Metric | What it is | What to look for |
| -------------------------- | --------------------------------------------------------- | --------------------------------------------------------------------------------------------------------------- |
| **Total Calls** | Calls your agent handled in the period | Sudden drops can mean an integration broke, not that traffic fell |
| **Success Rate** | Share of calls classified as successful | The clearest single signal that something is wrong. Compare against the previous period, not an absolute target |
| **Failed Calls** | Count of calls classified as failed | A high count alongside a stable success rate means volume grew, not quality dropped |
| **Hallucination Failures** | Failed calls where the agent hallucinated | Any hallucination warrants investigation — this is a trust problem, not a quality gradient |
| **Missed Intent Rate** | Share of calls where the agent didn't understand the user | A rising rate usually means real-world requests have drifted from the intents you defined |
Success Rate, Failed Calls, and Missed Intent Rate all depend on how you've defined [call outcomes and intents](/docs/evaluation/call-classification) — if these numbers look wrong, check those definitions before debugging the agent.
Per-call values like duration and cost aren't headline metrics — they appear on each call in **Call Logs**, and can be used as conditions in [red flag rules](/docs/evaluation/red-flags#available-condition-types).
## Breakdowns
Two charts show how calls distribute across your own labels:
* **User Intent Breakdown** — the mix of reasons people called
* **Call Outcome Breakdown** — the mix of results
These are most useful read together. An intent with high volume and a poor outcome share is where to spend your time first, and it's the same reasoning the [MCP diagnosis](/docs/mcp/diagnose) follows automatically.
## Recent red flags
The bottom section lists calls that tripped one of your rules, with the flag type, call ID, intent, outcome, and timestamp. This is your triage queue — see [Red flags and labels](/docs/evaluation/red-flags#triaging-what-the-flags-surface) for how to work it.
Red flags only appear here if you've defined rules. An empty queue on a busy agent usually means no rules exist yet, not that nothing went wrong.
***
## Next steps
Work through a single problem call end to end.
When the dashboard shows something is wrong, use the MCP to find why across every affected call.
Per-turn timing when the problem is speed rather than behavior.
Define the rules that populate the queue above.