What is the Overview Dashboard?
The Overview dashboard is your mission control for monitoring your AI agent. It provides a high-level summary of your agent’s performance, allowing you to quickly assess its health and identify potential issues. It’s the first place you should look to get a pulse on how your agent is doing.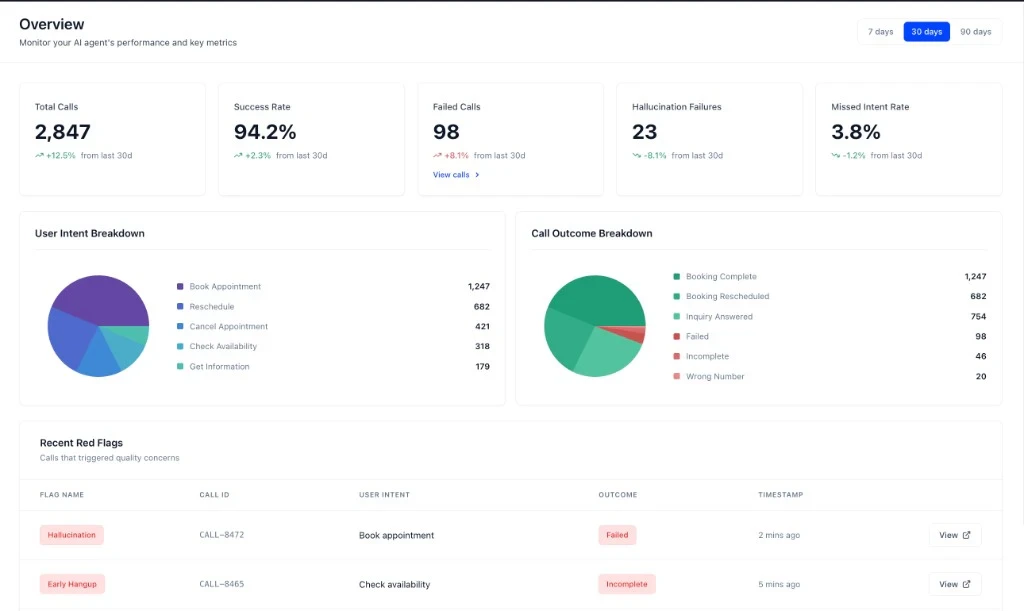
Key Metrics
The dashboard features five key metrics at the top, giving you an at-a-glance view of your agent’s performance over the selected time period (7, 30, or 90 days).Total Calls
The total number of calls your agent has handled.
Success Rate
The percentage of calls that were classified as successful.
Failed Calls
The total number of calls that were classified as failed.
Hallucination Failures
The number of failed calls where the agent hallucinated.
Missed Intent Rate
The percentage of calls where the agent failed to understand the user’s intent.
Charts
The dashboard includes two charts to help you visualize your agent’s performance:- User Intent Breakdown: A pie chart showing the distribution of user intents across all calls.
- Call Outcome Breakdown: A pie chart showing the distribution of call outcomes (e.g., Success, Failure).
Recent Red Flags
The Recent Red Flags section at the bottom of the dashboard highlights calls that have triggered quality concerns. This is your starting point for issue triage. You can see the flag type, call ID, user intent, outcome, and timestamp for each red-flagged call.Next Steps
Now that you understand the Overview dashboard, learn how to use red flags to triage issues.How to Use Red Flags for Issue Triage
A guide to using red flags to prioritize and investigate issues.