No setup required. Per-turn latency and voice metrics are captured automatically for every call as soon as your agent is integrated with Tuner — no additional configuration needed.
How Tuner Measures a Call
Most voice AI platforms give you a single end-to-end latency number. That number hides the problem. Tuner decomposes every turn in the conversation into its pipeline stages and shows you where time actually went — per turn, per node, and across the full call. The two views that surface this are:- The Transcript — per-turn latency badges inline with each message
- The Voice Metrics panel — aggregate latency statistics with percentile toggles (p50 / p90) and a conversation quality summary
The Three Pipeline Stages
Every agent turn involves three sequential stages. Each one is measured independently.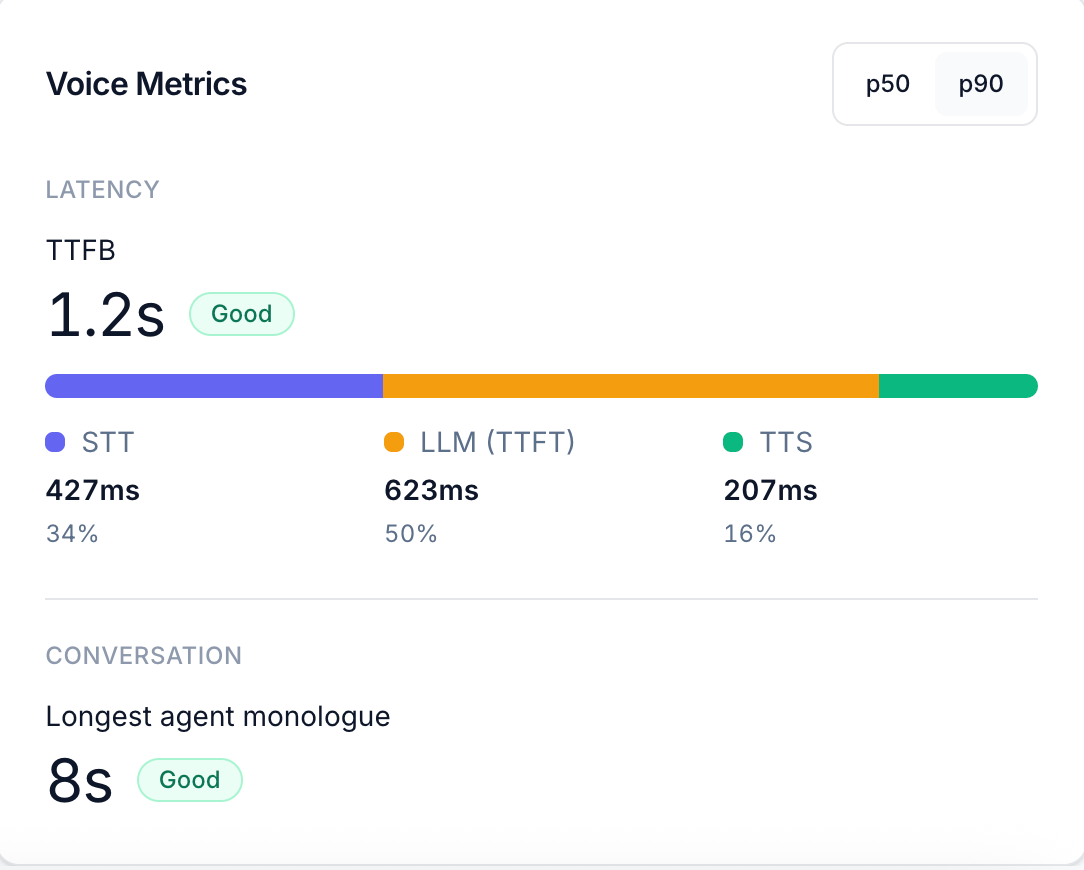
STT — Speech-to-Text
The time from the end of the customer’s utterance to when the transcript is ready for the LLM. The customer’s microphone audio travels through your voice provider’s STT engine and is transcribed before any processing can begin. Typical range: 100–600ms. Spikes here usually indicate provider-side transcription latency or network overhead between your infrastructure and the STT service. What to look for: Consistently high STT on every turn suggests the STT provider or network path is the bottleneck. High STT on specific turns only often means the utterance was long or the audio quality was poor.LLM — Time to First Token (TTFT)
The time from when the LLM receives the transcript to when it starts streaming the first token of the response. This is the reasoning time: prompt processing, context retrieval, and generation start. Typical range: 200ms–1s+, depending on model, context length, and whether tools were called. Tool calls add their own latency inside this window. What to look for: TTFT growing across a conversation signals context accumulation — as the conversation history grows, the model takes longer to process it. A single turn with unusually high TTFT often means a tool call was made or a long system prompt was processed.TTS — Text-to-Speech
The time from when the first token arrives to when the first audio chunk is playing back to the customer. The generated text is sent to your TTS engine, which synthesizes speech and streams it back. Typical range: 50–300ms. TTS is usually the smallest share of TTFB. What to look for: High TTS is less common but can indicate TTS provider latency or network issues. Very low TTS with high overall latency means the bottleneck is elsewhere.TTFB — Time to First Byte
TTFB (Time to First Byte) is the sum of all three stages:STT + LLM (TTFT) + TTS. It represents the end-to-end delay from the moment the customer stops speaking to the moment they hear the agent’s first audio.
The Voice Metrics panel shows TTFB as the headline number with a quality label (Good, Fair, or Slow), and the stacked bar underneath visualises the proportion each stage contributes.
You can toggle between p50 (median — typical call) and p90 (90th percentile — worst 10% of calls) to distinguish between your normal performance and your tail latency. A good p50 with a bad p90 means most calls are fine but a fraction are badly slow — often caused by a small number of high-latency tool calls or long model reasoning turns.
Per-Turn Latency in the Transcript
The transcript view shows latency badges on every turn so you can see exactly where in the conversation latency occurred.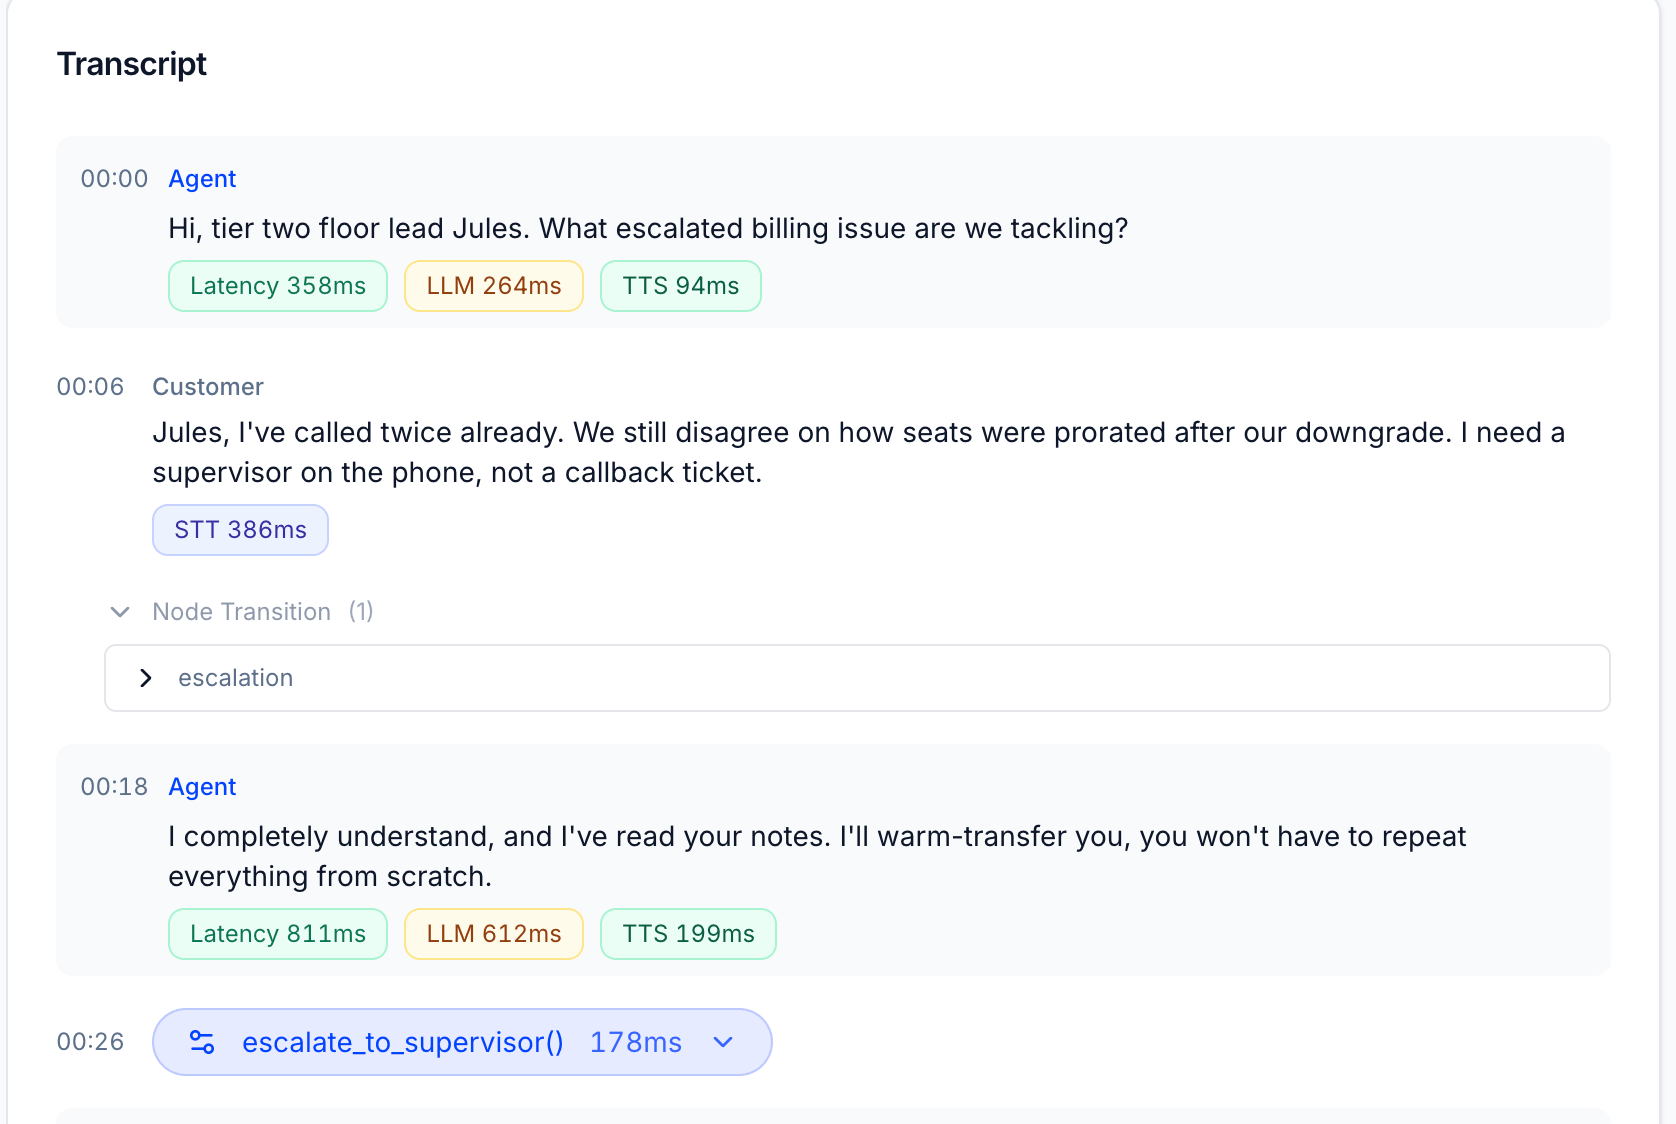
Agent turns
Each agent message shows three badges:| Badge | What it measures |
|---|---|
| Latency | Total TTFB for this turn (STT + LLM + TTS combined) |
| LLM | Time the model spent generating this response (TTFT) |
| TTS | Time to synthesize and stream the first audio chunk |
Customer turns
Customer messages show a single badge:| Badge | What it measures |
|---|---|
| STT | Time to transcribe this utterance |
Node Transitions
When the agent moves between workflow nodes, a Node Transition row appears in the transcript between the customer’s message and the agent’s response. It shows which node was entered and how many transitions occurred. This is particularly useful for agents built on graph-based or stateful workflow systems — you can see exactly when the agent changed state and correlate it with any change in latency.Tool Calls
When the agent invokes a tool, it appears as an inline row in the transcript at the exact timestamp it was called. The row shows the tool name, execution time, and can be expanded to inspect arguments and the response. Tool execution time is included inside the LLM badge for that turn — so if a turn has an unusually high LLM value, expanding any tool calls is the first place to look.Provider Variation
The exact stages available and their precision vary by voice provider. Not every provider exposes all three stages separately — some report only a combined latency figure. In those cases, Tuner shows what the provider reports and labels the breakdown accordingly. The general model (STT → LLM → TTS) holds across all providers, but the granularity of the split may differ. If you see a turn with only a single Latency badge and no LLM / TTS breakdown, your provider is not reporting per-stage timing for that turn.Conversation Quality Metrics
Below the latency breakdown, the Voice Metrics panel shows Conversation metrics that measure the shape of the dialogue rather than its speed.| Metric | What it measures |
|---|---|
| Longest agent monologue | The longest uninterrupted agent response in the call. Long monologues increase the chance of user disengagement. |
| Talk time | Total time the agent was speaking. |
| User talk time | Total time the customer was speaking. |
| Silence duration | Total silence across the call. Extended silence often indicates a slow tool call or the agent stalling. |
| Crosstalk duration | Time the agent and customer were speaking simultaneously — usually caused by the agent interrupting before the customer has finished. |
Next Steps
Introduction to Pre-defined Metrics
All voice and performance metrics Tuner computes out of the box.
Performing a Root Cause Analysis
How to use the transcript, events, and metrics together to debug a specific call.