

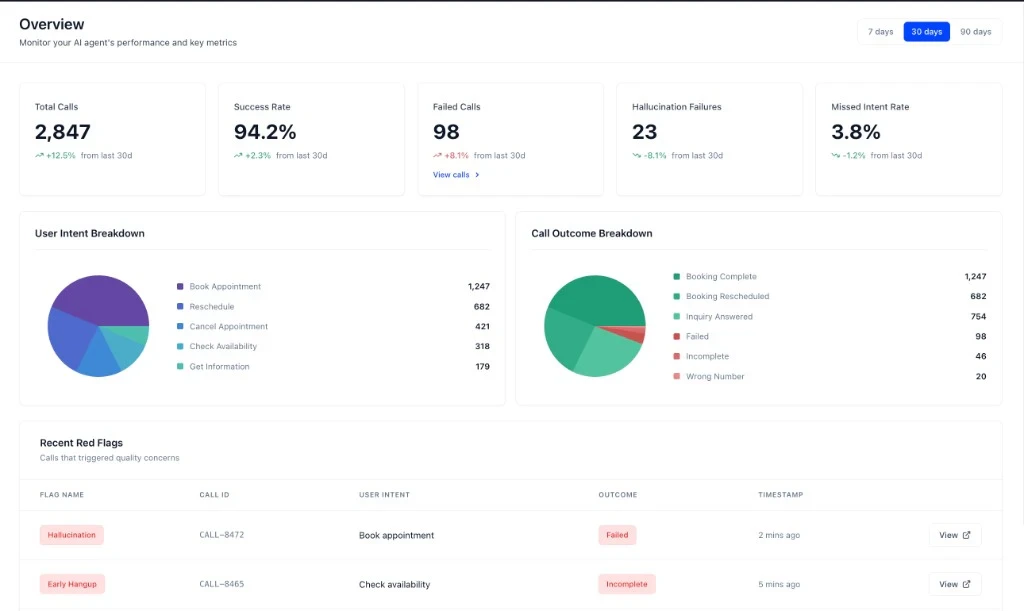
Headline metrics
Five metrics sit at the top, covering the period you select — 7, 30, or 90 days.
Success Rate, Failed Calls, and Missed Intent Rate all depend on how you’ve defined call outcomes and intents — if these numbers look wrong, check those definitions before debugging the agent.
Per-call values like duration and cost aren’t headline metrics — they appear on each call in Call Logs, and can be used as conditions in red flag rules.
Breakdowns
Two charts show how calls distribute across your own labels:- User Intent Breakdown — the mix of reasons people called
- Call Outcome Breakdown — the mix of results
Recent red flags
The bottom section lists calls that tripped one of your rules, with the flag type, call ID, intent, outcome, and timestamp. This is your triage queue — see Red flags and labels for how to work it. Red flags only appear here if you’ve defined rules. An empty queue on a busy agent usually means no rules exist yet, not that nothing went wrong.Next steps
Root cause analysis
Work through a single problem call end to end.
Diagnose your agent
When the dashboard shows something is wrong, use the MCP to find why across every affected call.
Voice metrics & latency
Per-turn timing when the problem is speed rather than behavior.
Red flags and labels
Define the rules that populate the queue above.