

What are red flags?
A red flag is a structured signal that Tuner attaches to a call when one or more rule conditions are satisfied. Unlike evals — which score individual behaviors — red flags represent a composite judgment: a call is flagged when a combination of eval failures, voice metrics, and call classification outcomes cross a threshold you define. The same Rule Builder that creates red flags also creates labels — contextual tags that categorize calls without marking them as failures (e.g.long_agent_monologue, sluggish_conversation). Both types appear in the call logs and are surfaced in the Overview dashboard.
Where red flags and labels surface
Overview dashboard
Red flags appear in the Recent Red Flags section of the Overview dashboard, giving you a prioritized queue of calls that need attention without requiring you to manually filter call logs.
Call logs
Both red flags and labels appear as color-coded tags on every call row in the call logs. This lets you filter and sort the full call history by the behavioral patterns you care about.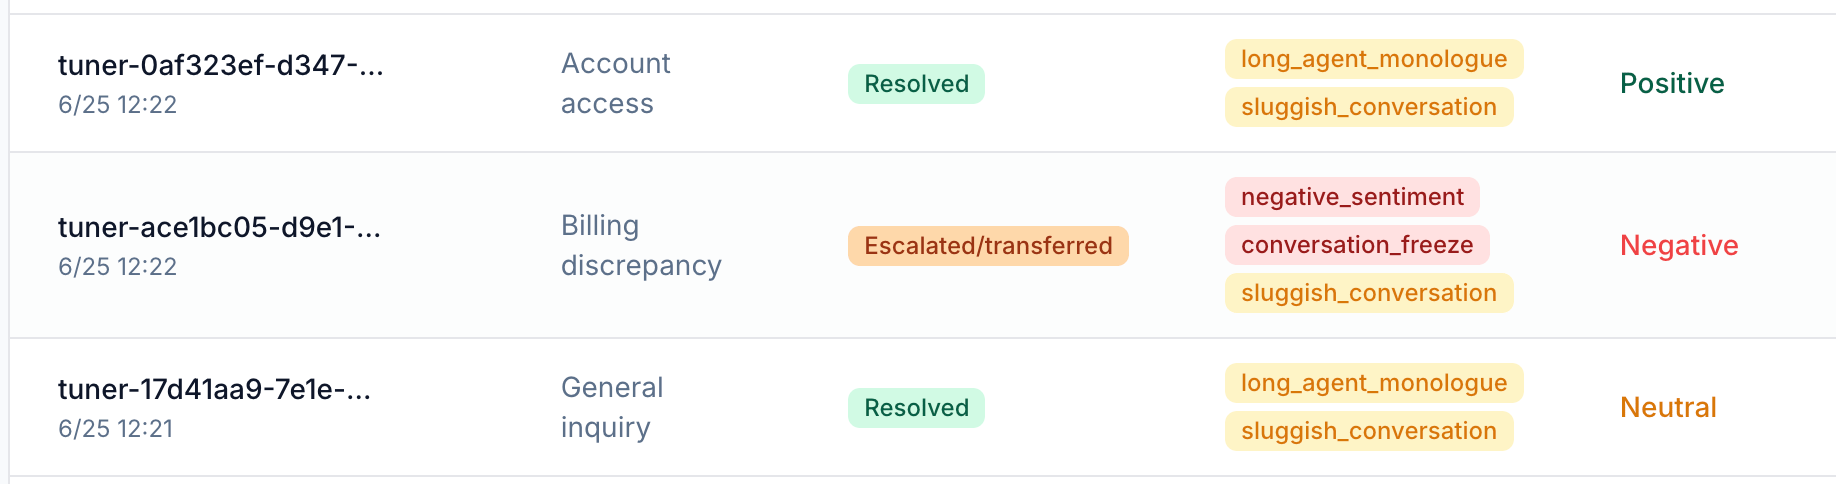
How red flags are triggered
Red flags and labels are defined in the Rule Builder inside Agent Settings → Evaluation Rules. Each rule is a named condition set. When all conditions in the set evaluate to true for a call, Tuner applies the corresponding tag to that call.Adding a rule
Click + Add Rule in the Evaluation Rules tab to open the rule builder.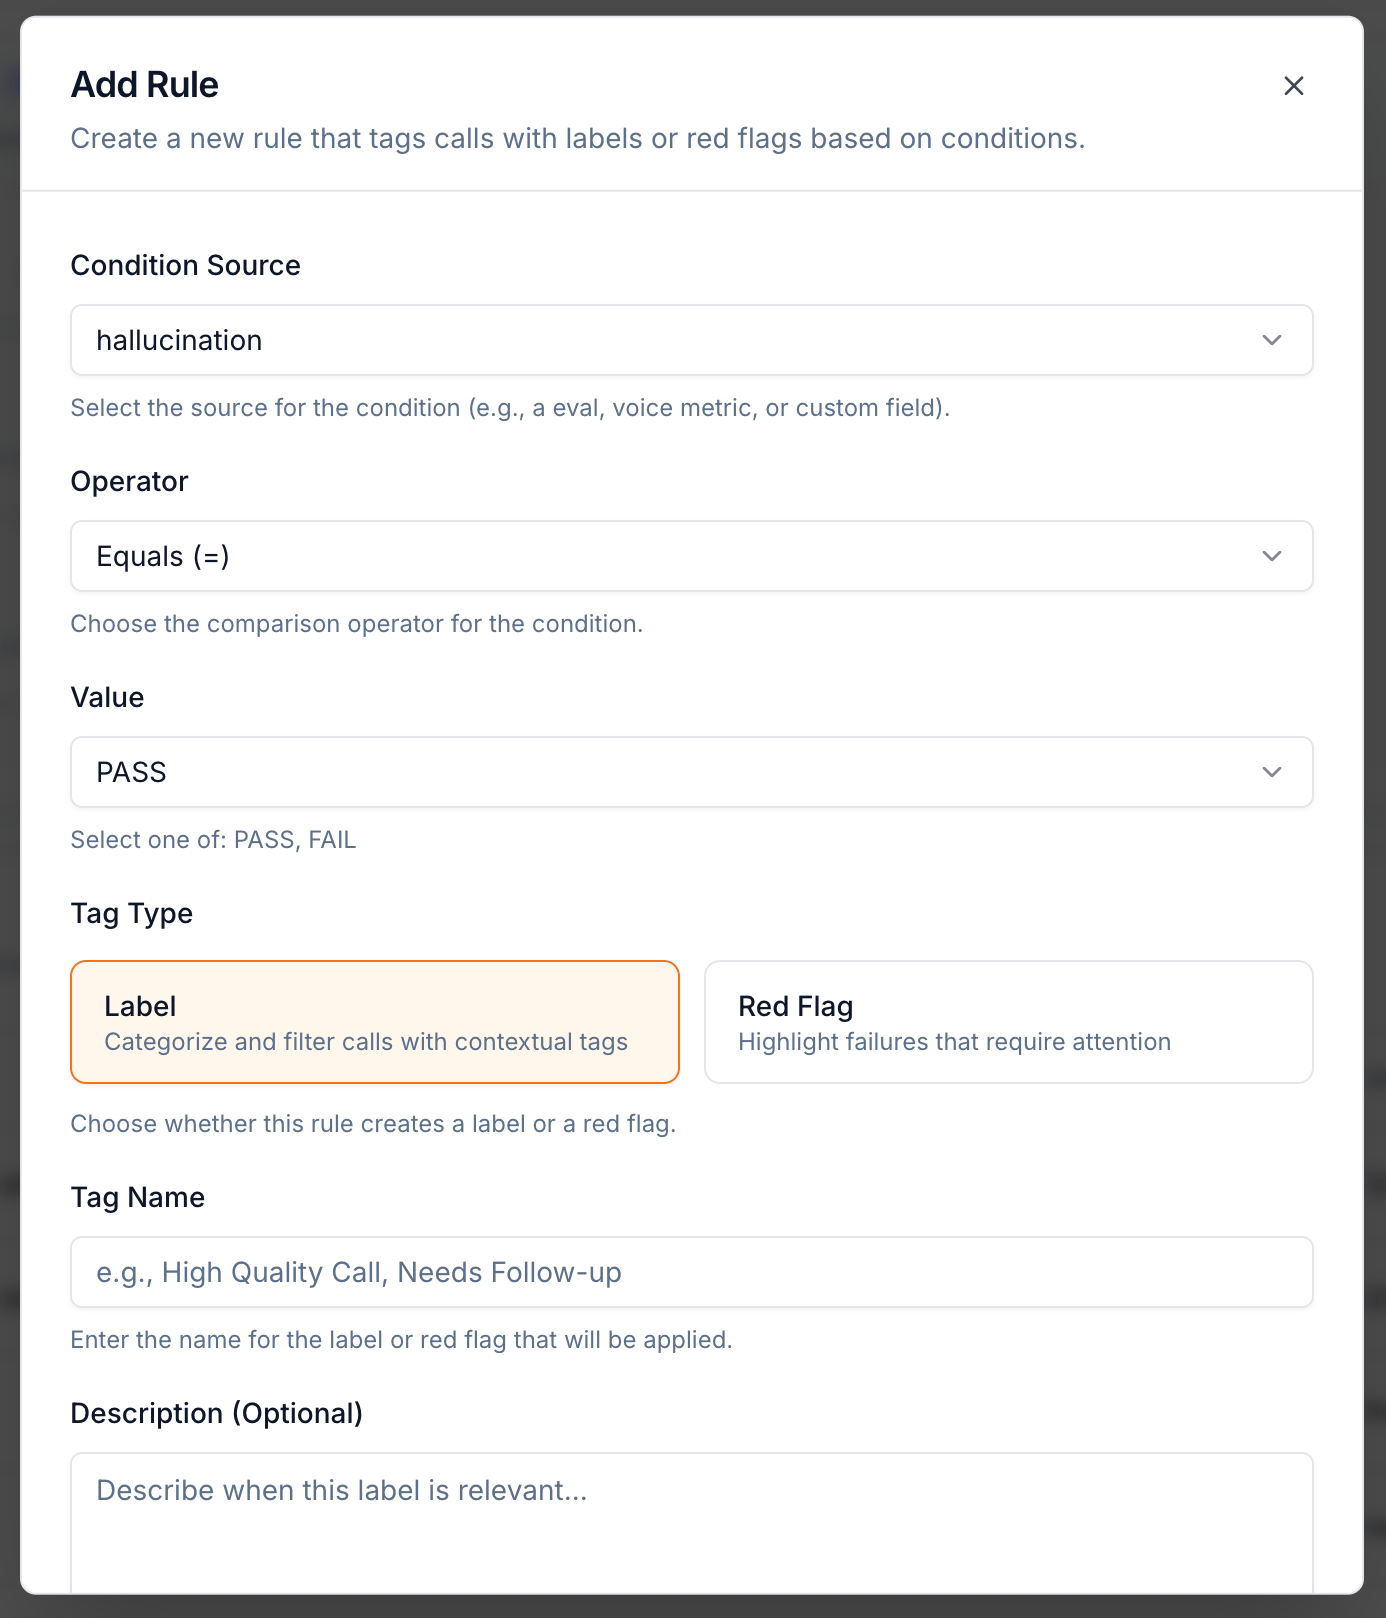
Available condition types
You can build conditions from any of the following signal sources:
Combining condition types lets you express nuanced failure patterns. For example, a “Frustrated and Mishandled” flag might require
Sentiment = Negative AND Missed Intent = FAIL AND Escalation Handling = FAIL — ensuring only calls with all three problems get flagged, not every slightly negative call.
Example rules
Hallucination detection
Compliance breach
High-risk failed call
Sluggish conversation (label)
Triaging what the flags surface
Once rules are in place, the Recent Red Flags section on the Overview dashboard becomes your daily queue.1
Check the queue daily
Red flags are a queue, not an archive. Reviewing them on a regular cadence is what turns them into an early warning system rather than a post-mortem record.
2
Prioritize by flag type
Hallucination and compliance flags come first — they indicate a fundamental problem with the agent’s behavior, not a degraded experience. Sentiment and latency flags can wait behind them.
3
Open the worst call
Click into a flagged call to get the full context before drawing conclusions from the flag name alone.
Investigating a red flag
Clicking View on any entry in the Recent Red Flags table — or clicking a flagged call in the call logs — opens the Call Details view. From there:- Transcript — Read the conversation verbatim to see exactly what was said at the point of failure.
- Events timeline — Trace the sequence of tool calls, transfers, and state transitions to find where the call went off track.
- Eval results panel — See all eval scores for the call in one view. A flag triggered by
hallucination = FAILwill show exactly which eval tripped and at what point in the transcript. - Voice metrics — Check for anomalies like extended silence, excessive crosstalk, or a large talk-time imbalance that correlate with the flag.
Investigating patterns at scale
When the same flag type recurs across many calls, investigating one at a time becomes impractical. The Tuner MCP Diagnose agent reads all calls sharing a flag type, clusters them by intent and outcome, surfaces the shared root cause, and can write a fix directly to your agent configuration.Diagnose your agent
Find the root cause behind recurring red flags across all your calls.
Alerting on red flags
Red flags are silent by default — they surface in the dashboard and call logs but do not notify anyone. To get notified when a flag fires, create an alert in Agent Settings → Alerts. When creating an alert, you can select a specific red flag as the trigger field — either by individual flag name (e.g.hallucination_detected, negative_sentiment) or by Red Flag Count to fire when any flag exceeds a threshold within a time window.
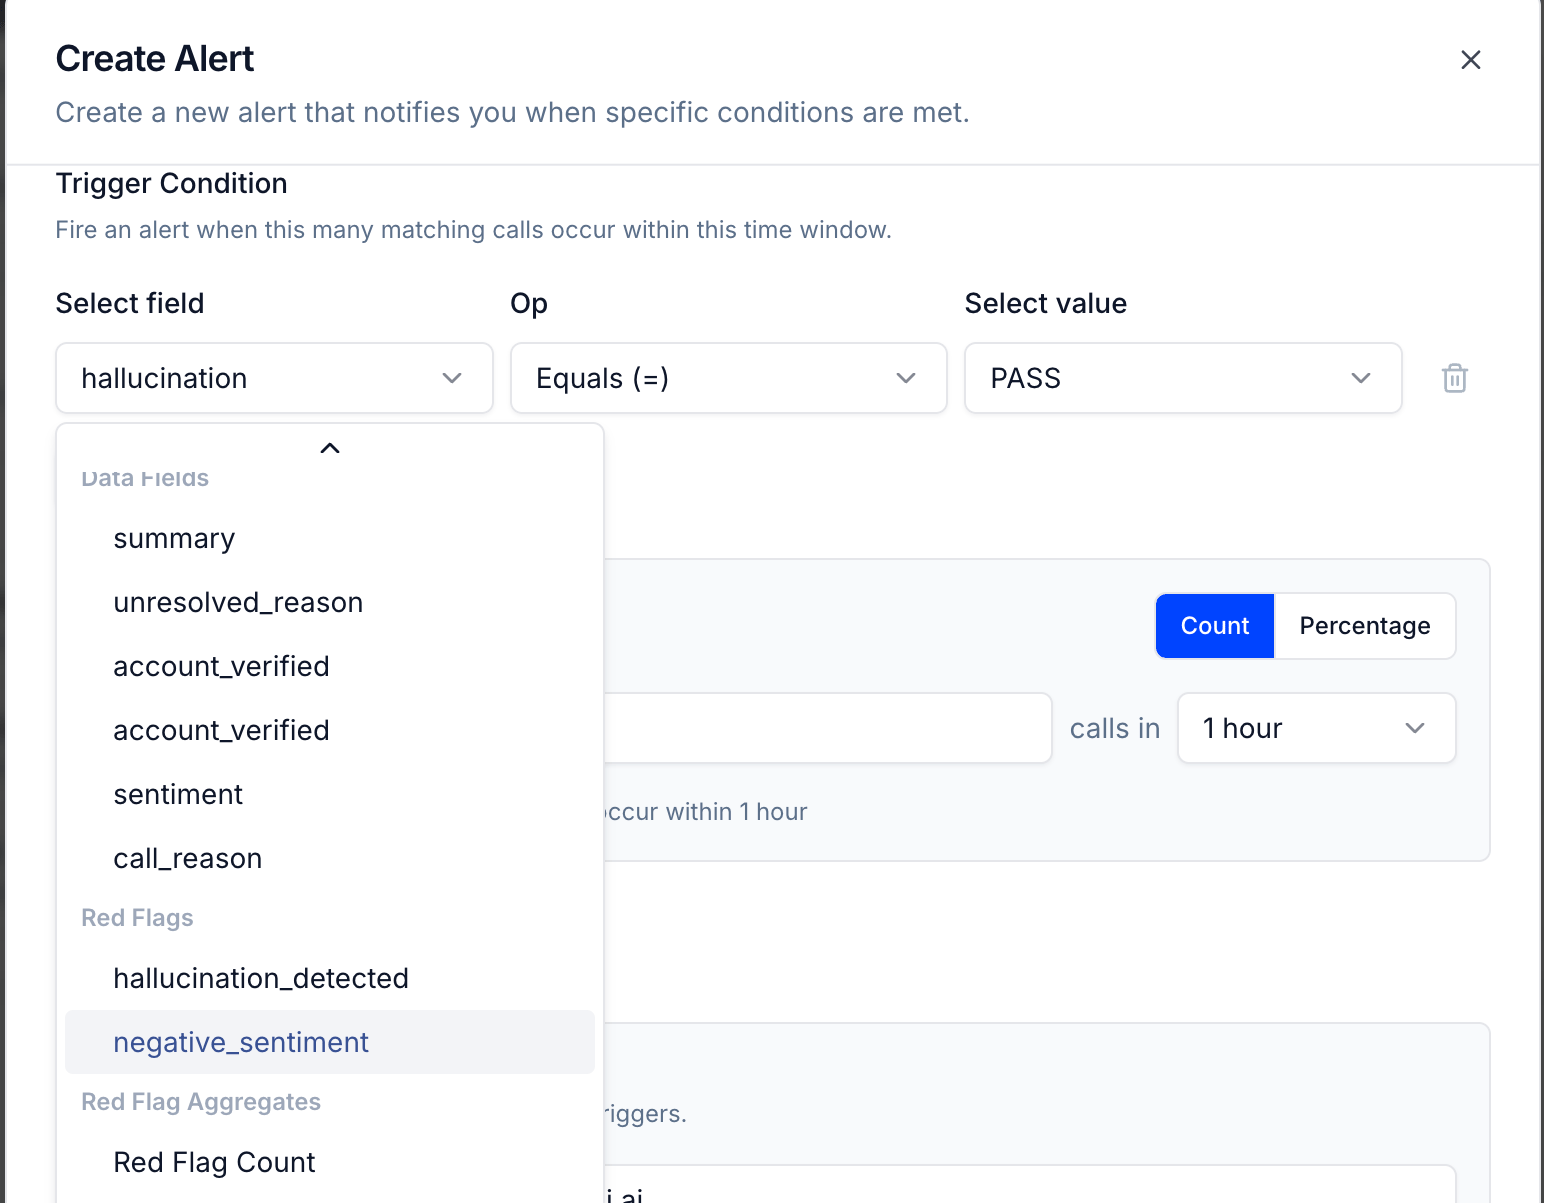
- Trigger field — a specific red flag, a data field, or Red Flag Count
- Operator and value — e.g.
Equals FAIL,greater than 3 - Count vs Percentage — fire when N calls match, or when X% of calls match
- Time window — evaluate the condition over the last 1 hour, 24 hours, etc.
Next steps
Real-time alerts
Route red flag notifications to email or a webhook.
Root cause analysis
A deep-dive walkthrough of a single call.
Diagnose your agent
Find root causes behind recurring flags across all calls.
Custom evals
The eval results most red flag rules are built on.