

No setup required. Per-turn latency and voice metrics are captured automatically for every call as soon as your agent is integrated with Tuner — no additional configuration needed.
How Tuner Measures a Call
Most voice AI platforms give you a single end-to-end latency number. That number hides the problem. Tuner decomposes every turn in the conversation into its pipeline stages and shows you where time actually went — per turn, per stage, and across the full call. Two views surface this:- The Transcript — per-turn latency badges inline with each message
- The Voice Metrics panel — latency broken down by stage, with p50 and p90 shown side by side, plus a conversation summary
The Pipeline Stages
Every agent response passes through four stages, each measured independently: EOU, STT, LLM, and TTS. These stages are not strictly sequential — they overlap in real time. Speech-to-text streams while the customer is still talking; endpointing runs concurrently with transcription. Because of this overlap, the stage timings do not add up to the total response latency, and Tuner never presents them as slices of a single bar. Each stage is a measurement in its own right, shown on a shared time axis so you can compare them directly.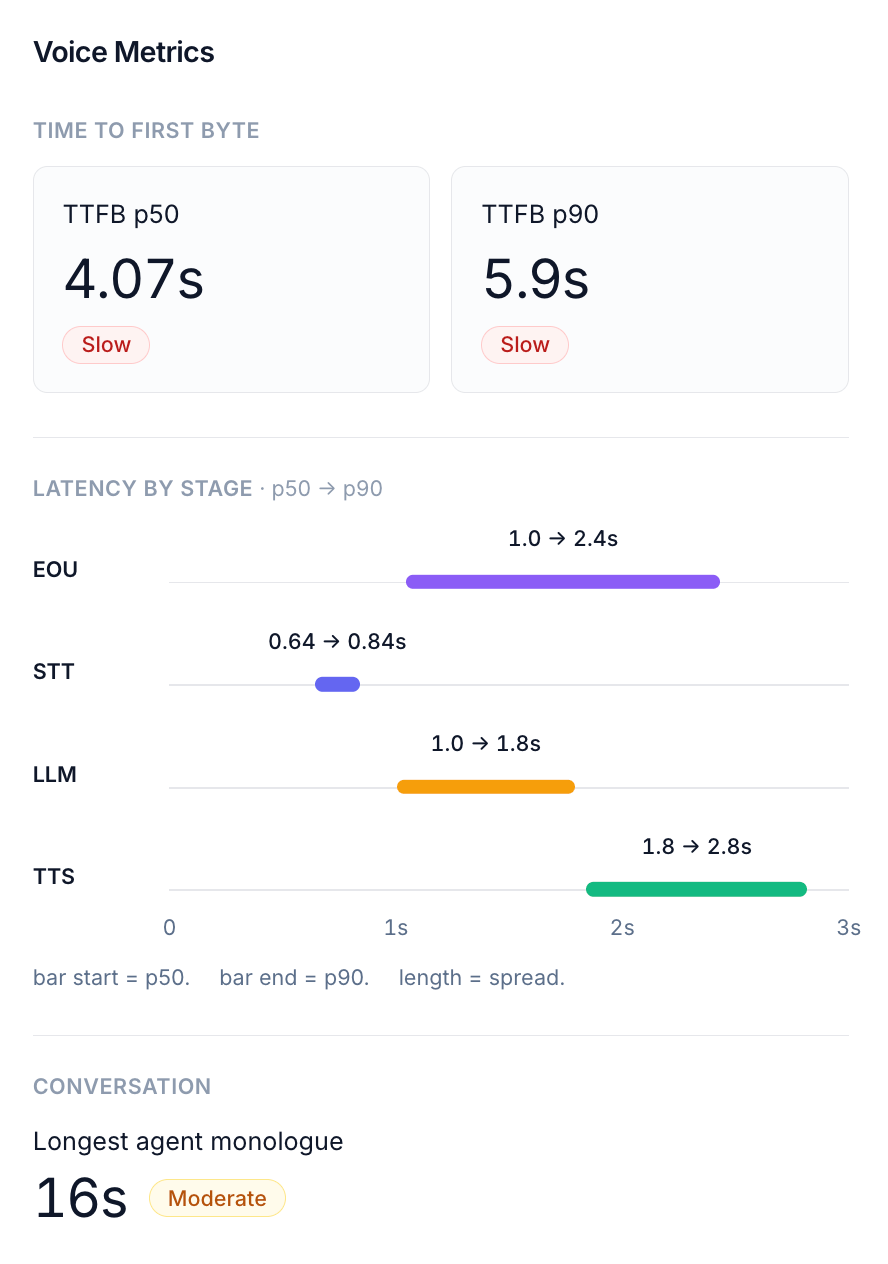
EOU — End of Utterance
The time the system waits, after the customer stops speaking, before it decides the turn is actually over and the agent can begin responding. This is endpointing delay — the pause between the customer finishing and the pipeline committing to “they’re done.” Typical range: 300–800ms, depending on your endpointing model and its sensitivity. Semantic or model-based endpointing trades a little latency here for fewer mid-sentence interruptions. What to look for: High EOU on a turn where the customer paused mid-thought usually means the endpointer waited through a silence timeout rather than detecting the end confidently. Consistently high EOU across the call points at conservative endpointing configuration — the agent feels slow to respond even when the rest of the pipeline is fast.STT — Speech-to-Text
The time from the end of the customer’s speech to when the transcript is ready for the LLM. The customer’s audio travels through your STT engine and is transcribed before any processing can begin. Typical range: 100–600ms. Spikes here usually indicate provider-side transcription latency or network overhead between your infrastructure and the STT service. What to look for: Consistently high STT on every turn suggests the STT provider or network path is the bottleneck. High STT on specific turns only often means the utterance was long or the audio quality was poor.LLM
The time attributed to the model on this turn — reasoning, prompt processing, and any tool calls made while generating the response.The exact measurement (time to first token vs. full generation time) currently varies by integration. See your framework’s integration page for specifics.
TTS — Text-to-Speech
The time from when the first token arrives to when the first audio chunk is playing back to the customer. The generated text is sent to your TTS engine, which synthesizes speech and streams it back. Typical range: 50–300ms. TTS is usually the smallest contributor to overall latency. What to look for: High TTS is less common but can indicate TTS provider latency or network issues. Very low TTS with high overall latency means the bottleneck is elsewhere.Reading the Stage Breakdown
For each stage, the Voice Metrics panel shows a range from p50 to p90 on a shared time axis:- p50 (median) — the typical case for that stage
- p90 (90th percentile) — the tail; nine out of ten turns were faster than this
TTFB — Time to First Byte
TTFB (Time to First Byte) is the end-to-end delay a customer actually experiences: the time from the moment they stop speaking to the moment they hear the agent’s first audio. TTFB is not the arithmetic sum of the four stages. Because the stages overlap in real time, adding them would overstate the real delay. TTFB is measured directly as the perceived gap, and the stage breakdown explains where that gap comes from — not by summing to it, but by showing which stage dominated and which was most variable. The panel shows TTFB as two headline numbers — p50 and p90 — each with a quality label (Good, Fair, or Slow). Showing both at once is deliberate: a good p50 with a bad p90 means most turns are fine but a fraction are badly slow, typically caused by a few high-latency tool calls or long model-reasoning turns. That split is the single most common latency signature, and you read it in one glance instead of toggling.Per-Turn Latency in the Transcript
The transcript shows latency badges on every turn so you can see exactly where in the conversation latency occurred.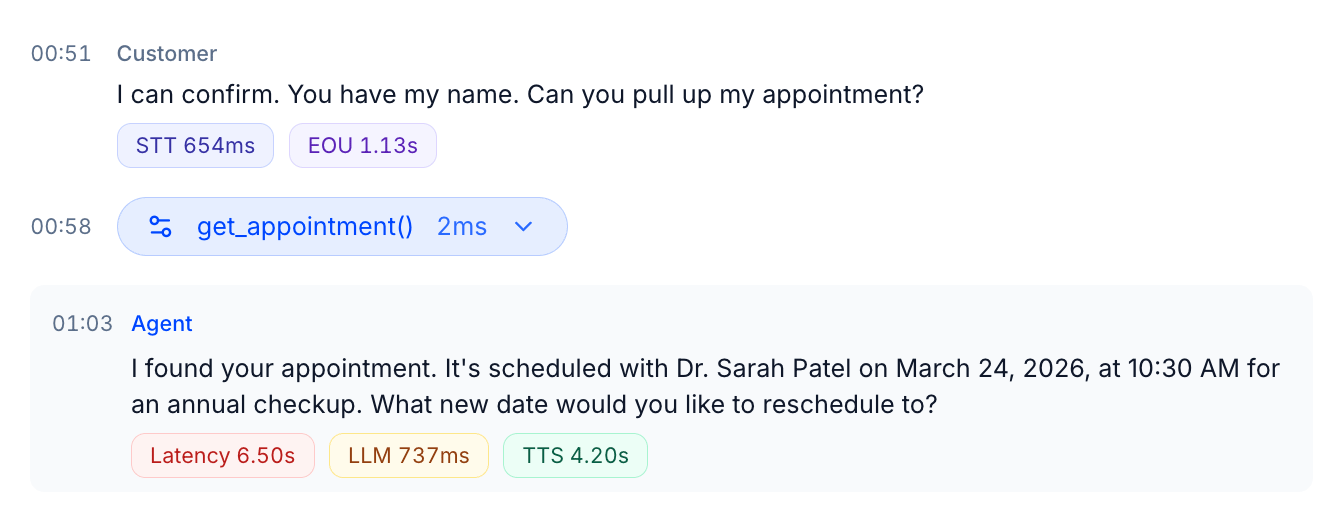
Agent turns
Customer turns
Node Transitions
When the agent moves between workflow nodes, a Node Transition row appears in the transcript between the customer’s message and the agent’s response. It shows which node was entered and how many transitions occurred. This is particularly useful for agents built on graph-based or stateful workflow systems — you can see exactly when the agent changed state and correlate it with any change in latency.Tool Calls
When the agent invokes a tool, it appears as an inline row in the transcript at the exact timestamp it was called. The row shows the tool name, execution time, and can be expanded to inspect arguments and the response. Tool execution time falls inside the LLM window for that turn — so if a turn has an unusually high LLM value, expanding any tool calls is the first place to look.Provider Variation
The exact stages available and their precision vary by voice provider and stack. Not every provider exposes all four stages separately — some report only a combined latency figure, and endpointing (EOU) in particular is only available from stacks that emit it (for example, our LiveKit and Pipecat SDKs). When a stage isn’t reported, Tuner shows what it has and omits what it doesn’t — a stage with no data is left out of the breakdown rather than shown as zero, which would falsely imply the stage was instant. If a turn shows only a single Latency badge with no per-stage breakdown, your provider isn’t reporting per-stage timing for that turn.Conversation Metrics
Alongside latency, the Voice Metrics panel surfaces one conversation-shape metric:
Other call-level signals, such as sentiment, are captured separately as data-extraction fields rather than voice metrics. See Introduction to Pre-defined Metrics for the full catalog of what Tuner computes out of the box.
Going deeper with traces
The stage breakdown tells you which stage of a turn was slow. It does not tell you what ran inside that stage. If your agent is built on LiveKit Agents or Pipecat, you can send its OpenTelemetry spans to Tuner and get that layer as well: a span tree per call, showing the model request, the synthesis stream, and each tool call, with the timing of each. The two views answer different questions. Voice Metrics measures the latency your customer perceived, on every call, with no setup. A trace shows the operations that produced that latency, and needs a one-time exporter change in your agent.OpenTelemetry Traces
How to read a span tree, and how to turn traces on for LiveKit Agents or Pipecat.
Next Steps
Predefined evals
The 21 evals Tuner ships with, and what each one checks.
Performing a Root Cause Analysis
How to use the transcript, events, and metrics together to debug a specific call.